4 Features of Google Analytics You Aren't Using
 Note: This article was written about Universal Analytics, which was decommissioned in July 2023.
Let’s say you have a green thumb. You spend days, maybe weeks, deciding which veggies and flowers you want and finally planting the perfect garden. When you’re done, you proudly dust off your hands and then… never return to it again.
Meticulously planting a garden and then letting it go is like setting up a website and then not tracking the analytics. You have to keep an eye on it to monitor and measure its success. You have to keep the bugs away, prune the poorly performing pages and facilitate its growth.
That’s where Google Analytics comes in. At Elevate My Brand (EMB), it’s our go-to tool—though not our only tool—to track traffic and make data-driven decisions to impact your visibility, awareness and sales. If you aren’t using it, you’re missing out on a lot of SMART decision-making.
But Google Analytics is a leviathan tool with a ton of insightful functions, so even those who already use it are probably missing out on some of Google Analytics’ best features.
What Google Analytics Can Do
With Google Analytics, you can see how many users are on your site in real time, how long users stay on the site, what your most popular pages are and more. But those are the basic uses. Here are four functions you probably aren’t using but should in order to elevate your analytics game.
Reverse Goal Path
Where it is: Conversions > Goals > Reverse Goal Path
What it does: takes you backwards through the customer journey from entrance to conversion
Everyone should have goals set in their Google Analytics account to track conversions, whether that’s a specific page visit, visit duration or an event, such as a download or video view. The Reverse Goal Path feature shows you how your users arrived at that conversion. For instance, you can see the percentage of people who landed on the home page, went to About Us and then clicked on Services before heading to Contact (your goal).
Why is this important? You can draw conclusions about which pages and content actually drive conversions. If 70% of users get to Contact immediately after viewing a landing page attached to a particular social ad, then you know that social ads are the way to drive conversions on the site. If you see that no one is getting to your goal page after reading your About Us, then you need to update that content, add a sexier call-to-action or deactivate that page altogether. Plus, this lets you know that your company identity is not a motivator to potential customers or clients, so you can adjust your content strategy accordingly.
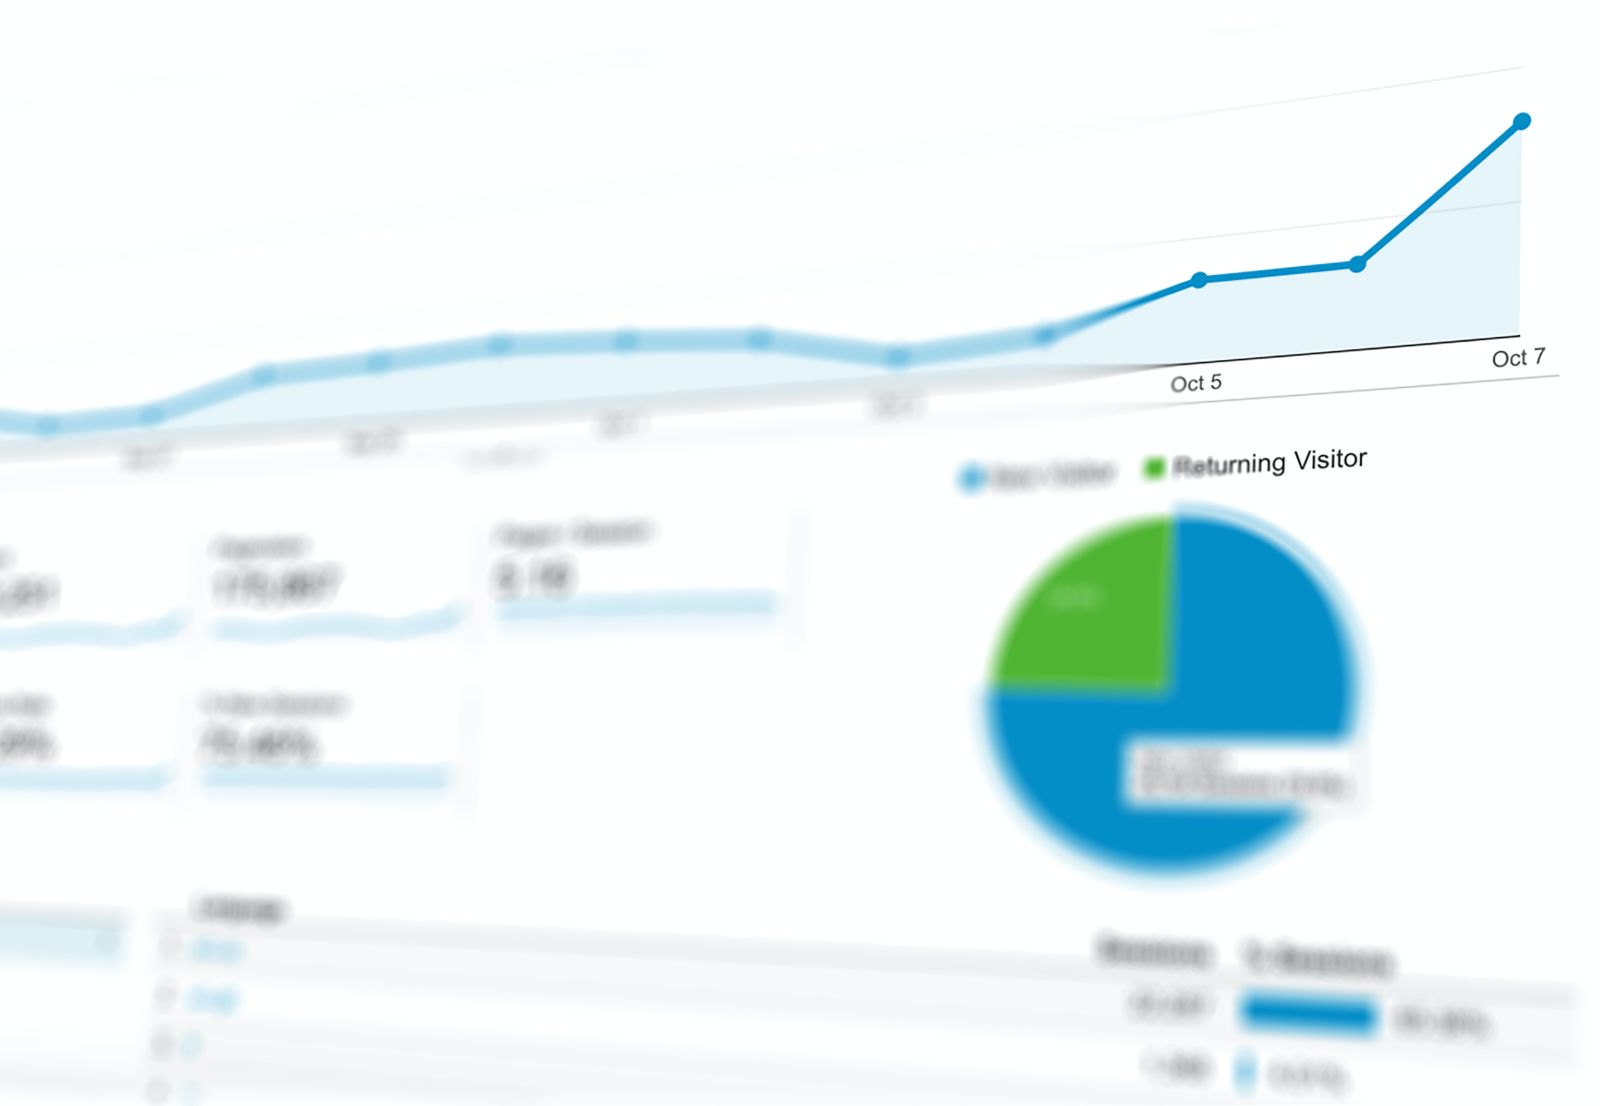
Data Visualization
Where it is: Acquisition > All Traffic > Channels (and other places)
What it does: provides visual representation of data in various forms, such as bar and pie graphs
The data visualization feature can be found in a few different places. Whenever you’re checking out a chart of info, look to the top-right corner of the chart to see if there are six small buttons that look like bar graphs, pie graphs, etc. When you click those buttons, Google Analytics transforms the data in the spreadsheet into other, more digestible formats that you can use to populate reports.
Why is this important? Not everyone understands a spreadsheet, so being able to translate data into a visual format is critical. The fact that Google Analytics does it for you is fantastic. And not only that, but each visualization looks at the data from a different angle. The pie graph shows Percentage; the bar graph shows Performance; and the term cloud shows you Prominence.
Affinity Categories
Where it is: Audience > Interests > Affinity Categories
What it does: tells you the interests and behaviors of your visitors
If you use Google Ads, then you are probably familiar with affinity categories. These are broad groups of “lifestyles, passions and habits” such as Movie Lovers and Coffee Shop Regulars and even Frequently Eats Dinner Out. Google tracks these types of interests and behaviors based on users’ searches and online habits. And we reap the benefits.
Why is this important? One of the most cost-effective ways to build your brand and audience is through strategic partnerships. You can check the affinity categories on Google Analytics and let those groups guide your decisions on which non-competitive ancillary brands are best. If 10% of your customers are already Green Living Enthusiasts, for instance, then talking about the company’s sustainability and aligning yourself with green partners is a great idea.
Demo Access
Where it is: Discover > Google Analytics Demo Account
What it does: shows you what a fully functional Google Analytics account looks like
Whether you’re an Analytics novice or a veteran, you’re probably always asking, “What else can I do to improve my account?” Well, look no further for advice than Google itself. You can view the actual Analytics account for the Google Merchandise Store. Seriously! Google uses its own store to show us what a “fully functional” account and “real business data” looks like.
Why is this important? First and foremost, it shows us how to do it the right way from the people who built the system. It’s an aspirational account that pulls back the curtains on all the analytical opportunities. It also shows us some beta features before they launch to everyone. As an example, I can see that Google has Conversion Probability under Audience > Behavior. Our accounts don’t have this yet, but it’s nice to know what’s on the horizon. The best part of Demo Access, though, is that you can experiment with data and reports without worrying about breaking anything.
What Our Analytics Experts Can Do
I’ve said it before, and I’ll say it again: Google Analytics is a behemoth. It’s a beast, but it’s an absolutely necessary tool to measure the success of a website. If you need a team to monitor your Analytics account, we’ve got your EMBack. Let’s chat about how we can elevate your brand with data and strategy today!
Cody H. Owens, Account Executive
Elevate My Brand